Investment returns: total return and annualized return (CAGR)
Total return includes price change and income; CAGR turns a multi-year return into a steady yearly rate. Why averaging yearly returns overstates growth.
Total return = (ending value + income − starting value) ÷ starting value × 100. An $8,000 investment worth $11,200 after 4 years, with $400 of dividends, returned 45%. CAGR = (ending ÷ starting)^(1 ÷ years) − 1, which for 1.45 over 4 years is about 9.7% a year.
On this page
There are two common ways to describe how an investment did: the total return over the whole period, and an annualized rate that spreads it evenly across the years.
Total return
total return = (ending value + income received − starting value) ÷ starting value × 100
You invested $8,000. Four years later it’s worth $11,200, and you received $400 in dividends along the way. Total return: (11,200 + 400 − 8,000) ÷ 8,000 = 3,600 ÷ 8,000 = 45%.
Try it: $8,000 to $11,600 including dividends
Open in calculatorLeaving out the dividends gives a price return of 40%. If an investment pays income, the total return is the fairer measure.
Annualized return (CAGR)
A 45% return over four years isn’t 11.25% a year, because returns compound. The compound annual growth rate is the steady yearly rate that would turn the starting value into the ending value:
CAGR = (ending value ÷ starting value)^(1 ÷ years) − 1
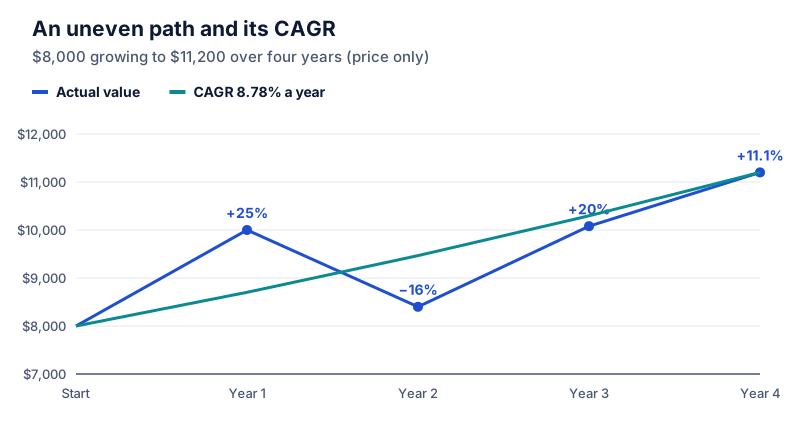
For the total return: 1.45^(1/4) = 1.0973, so about 9.7% a year. For price alone: 1.40^(1/4) = 1.0878, about 8.8% a year.
Why averaging yearly returns overstates growth
The investment’s price went +25%, −16%, +20% and +11.1% over the four years. The simple average of those is about 10%. But 8,000 × 1.10^4 = $11,713, more than the $11,200 it actually reached.
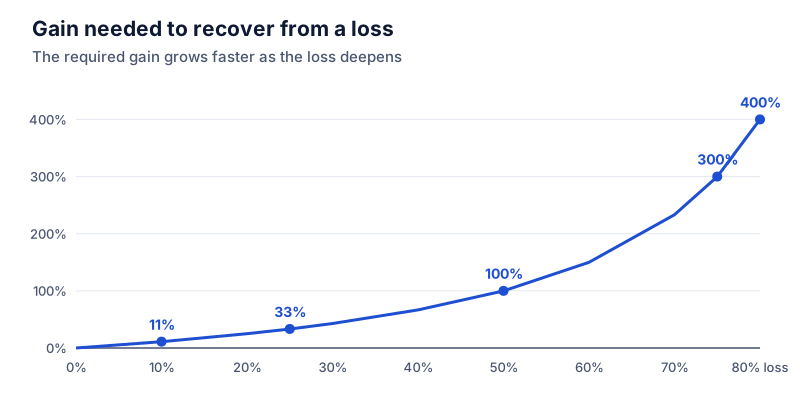
The arithmetic average ignores that a loss shrinks the base for later gains. The extreme case: +50% then −50% averages to 0%, but $100 becomes $150 and then $75, a 25% loss. CAGR handles this correctly. See recovering from a percentage loss.
Try it: The first three years: +25%, −16%, +20%
Open in calculatorFees and inflation
Returns are usually reported before inflation. To get a real return, divide by inflation: a 9.7% nominal return with 3% inflation is 1.097 ÷ 1.03 − 1 = 6.5% real. Fees matter too. A fund returning 8% before a 1% fee leaves you about 7%, and over decades that gap compounds. See inflation and purchasing power.
Returns of less than a year
Annualizing short-term returns can mislead. A 3% gain in one month, annualized, is 1.03^12 − 1 = 42.6%. That’s arithmetic, not a forecast. Report short-period returns as they are.
Comparing investments
Use the same measure for each: total return over the same dates, or CAGR over the same number of years. Comparing one investment’s total return with another’s annual return is a common error. So is comparing a fund’s price return with another’s total return.
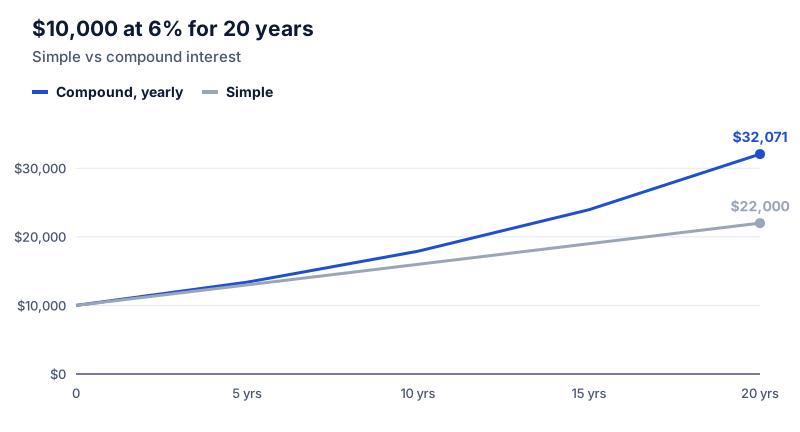
For more on chaining yearly changes, see successive percentage changes. For how interest compounds, see compound interest.
Questions
Should I include money I added during the period?
Not in a simple return. New deposits aren’t gains. For accounts with regular contributions, use a money-weighted return (often shown as personal rate of return) or calculate returns between deposits.
Is CAGR the return I'll get next year?
No. It’s a description of the past, smoothed into a steady rate. Actual yearly returns will vary.
The calculator links in this guide are checked against the PercentSwift calculator every time the site is built. How we calculate explains the rounding rules. If you spot a mistake, email hello@percentswift.com.