Why percentages don't always add up to 100
Rounded shares can total 99% or 101%, and multi-answer questions can total far more. Why it happens, when it signals an error, and how to round so the parts add up to exactly 100%.
Rounding each share separately causes small gaps: 33.83%, 33.67% and 32.5% round to 34 + 34 + 33 = 101%. That’s normal and usually noted under the table. Totals far from 100% mean something else: a multiple-answer question, missing categories, or shares computed against different bases.
On this page
A survey table shows 34%, 34% and 33%. That’s 101%. Did someone make a mistake? Usually not. There are a few distinct reasons a set of percentages misses 100, and only some of them are errors.
Rounding
A survey of 600 people picks one of three options: 203 choose A, 202 choose B and 195 choose C.
Try it: 203 of 600
Open in calculatorThe exact shares are 33.83%, 33.67% and 32.5%, which add to exactly 100%. Rounded to whole numbers, they become 34%, 34% and 33%: a total of 101%.
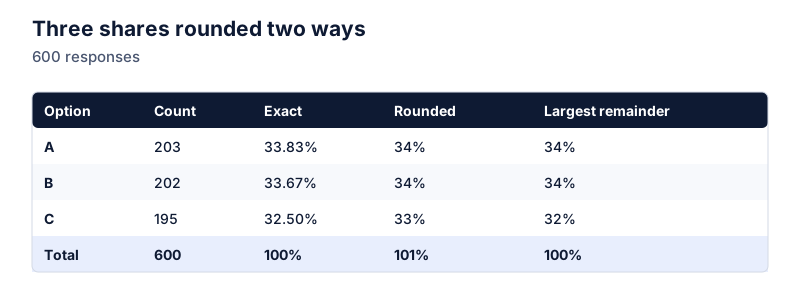
Each share is rounded on its own, and the rounding errors (+0.17, +0.33, +0.5) happen to point the same way. With more categories, the total can drift further, by up to about half a point per category in the worst case.
Making rounded shares add up
The largest remainder method fixes the total with the smallest possible changes:
- Round every share down: 33, 33, 32. Total 98.
- Count how many points are missing: 100 − 98 = 2.
- Give one point each to the shares with the largest decimal parts: .83 (A) and .67 (B).
Result: 34%, 34%, 32%. Every published figure is within one point of its exact value, and the total is 100%.
In a spreadsheet you can do the same thing with a helper column, or simply show one decimal place and add a rounding note.
Multiple-answer questions
“Which apps do you use? Select all that apply.” If 70% use email, 60% use chat and 45% use video, the total is 175%. That’s correct: each percentage is the share of respondents who picked that option, and people picked more than one. These results shouldn’t go in a pie chart. Use bars, and say that respondents could choose several answers.
Missing categories
If the shares add to 92%, check for an unlisted “Other,” “Don’t know” or “No answer” group. Leaving it out is fine if you say so, but the reader should know the parts don’t cover everyone.
Different bases
Percentages calculated against different totals can’t be added. “40% of men and 50% of women” doesn’t mean 90% of anyone. To combine them you need the counts, as explained in averaging percentages.
Quick diagnosis
- Total is 99–101%: rounding. Note it or use the largest remainder method.
- Total is well over 100%: multiple answers allowed, or overlapping groups.
- Total is well under 100%: missing categories.
- Percentages from different groups: they shouldn’t be added at all.
For building the table itself, see percentage of total in a table and relative frequency. Survey results also carry sampling error, covered in margin of error.
Questions
Should I force rounded percentages to add to 100?
For published charts and pie charts, many people prefer it, and the largest remainder method does it with the smallest changes. In data tables, it’s also fine to show the honest rounded values and add a note such as “Figures may not sum to 100% due to rounding.”
Does showing more decimal places fix it?
It shrinks the gap but doesn’t remove it. With one decimal place the total can still be 99.9% or 100.1%.
The calculator links in this guide are checked against the PercentSwift calculator every time the site is built. How we calculate explains the rounding rules. If you spot a mistake, email hello@percentswift.com.