Relative frequency and cumulative percentages
Turn raw counts into a percentage distribution: relative frequency is each count ÷ the total, and cumulative percentage is the running total of those. A worked frequency table.
Relative frequency = count in a category ÷ total count × 100. Cumulative percentage = the running total of relative frequencies. If 17 of 50 people commute 15–30 minutes, that’s 34%, and with the 16% who commute under 15 minutes, 50% commute 30 minutes or less.
On this page
A frequency table counts how many observations fall in each category. Converting the counts to percentages makes the table easier to read and to compare with tables of different sizes.
The table
Commute times reported by 50 employees:
| Commute | Count | Relative frequency | Cumulative |
|---|---|---|---|
| Under 15 min | 8 | 16% | 16% |
| 15–30 min | 17 | 34% | 50% |
| 30–45 min | 14 | 28% | 78% |
| 45–60 min | 7 | 14% | 92% |
| Over 60 min | 4 | 8% | 100% |
| Total | 50 | 100% |
Relative frequency
Divide each count by the total. 15–30 minutes: 17 ÷ 50 = 34%.
Try it: 17 of 50 employees
Open in calculator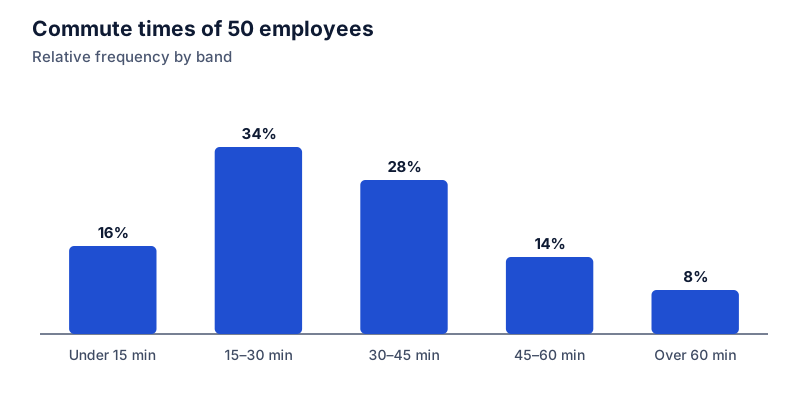
The relative frequencies always add to 100% (before rounding), since every observation is in exactly one category.
Cumulative percentage
Add the relative frequencies from the top down. The cumulative column answers “what share is at or below this level?”
- 50% commute under 30 minutes (16 + 34).
- 78% commute under 45 minutes (16 + 34 + 28).
You can also get these directly from counts: 8 + 17 + 14 = 39 people under 45 minutes, and 39 ÷ 50 = 78%.
Try it: 39 of 50 commute under 45 minutes
Open in calculatorReading the median from the cumulative column
The median is where the cumulative percentage crosses 50%. Here it reaches exactly 50% at the end of the 15–30 band, so the median commute is about 30 minutes. If the 50% mark falls inside a band, the median is somewhere in that band.
Comparing two groups
Relative frequencies let you compare groups of different sizes. If another office of 120 employees has 30 people commuting over an hour, that’s 25%, versus 8% here. The raw counts (30 vs 4) exaggerate the difference because the offices differ in size, and the percentages correct for that.
Rounding
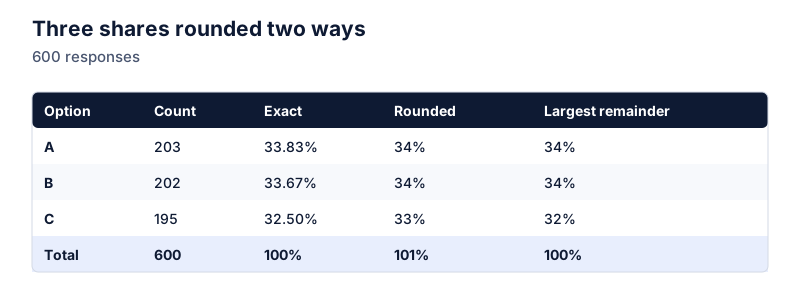
With awkward totals, rounded relative frequencies might add to 99% or 101%. For example, three categories of 1, 1 and 1 out of 3 each round to 33%, totaling 99%. See why percentages don’t add to 100.
Related
Percentile ranks use cumulative percentages too: see percentage vs percentile. For two-way tables with row and column totals, see percentage of total in a table.
Questions
What's the difference between relative frequency and probability?
Relative frequency describes data you’ve collected. If the sample is large and representative, it’s often used as an estimate of probability.
Should a band boundary like 30 minutes go in the lower or upper band?
Pick one rule and state it, for example “15–30 means at least 15 and less than 30.” Otherwise values on the boundary can be counted twice or not at all.
The calculator links in this guide are checked against the PercentSwift calculator every time the site is built. How we calculate explains the rounding rules. If you spot a mistake, email hello@percentswift.com.