How to average percentages correctly
A simple average of percentages is only right when every group is the same size. How to weight by group size, with a worked example and the shortcut of going back to the counts.
Don’t average percentages from groups of different sizes. Add up the underlying counts and divide instead. A store with 10% conversion from 200 visitors and another with 4% from 1,800 visitors have a combined rate of 92 ÷ 2,000 = 4.6%, not the 7% a simple average gives.
On this page
Averaging percentages looks like it should work, and it often gives a wrong answer.
Example
| Visitors | Orders | Conversion rate | |
|---|---|---|---|
| Store A | 200 | 20 | 10% |
| Store B | 1,800 | 72 | 4% |
| Combined | 2,000 | 92 | 4.6% |
Simple average of the rates: (10 + 4) ÷ 2 = 7%. Actual combined rate: 92 ÷ 2,000 = 4.6%.
Try it: 92 orders from 2,000 visitors
Open in calculator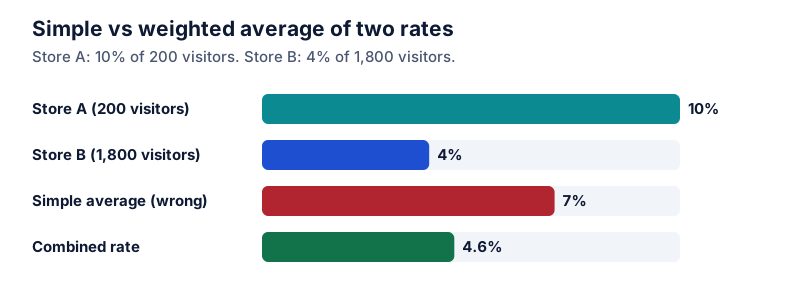
The simple average treats both stores as equally important, but Store B had nine times as many visitors.
The fix: go back to counts
- Convert each percentage back into a count, if you don’t have counts already: 10% of 200 = 20, 4% of 1,800 = 72.
- Add the counts: 92.
- Add the bases: 2,000.
- Divide: 92 ÷ 2,000 = 4.6%.
Weighted average formula
This is the same as weighting each percentage by its group size:
weighted average = Σ(percentage × group size) ÷ Σ(group sizes)
(10 × 200 + 4 × 1,800) ÷ 2,000 = (2,000 + 7,200) ÷ 2,000 = 4.6%.
Where this comes up
- Test sections with different numbers of points. See test score percentage.
- Pass rates across classes of different sizes. See class average and pass rate.
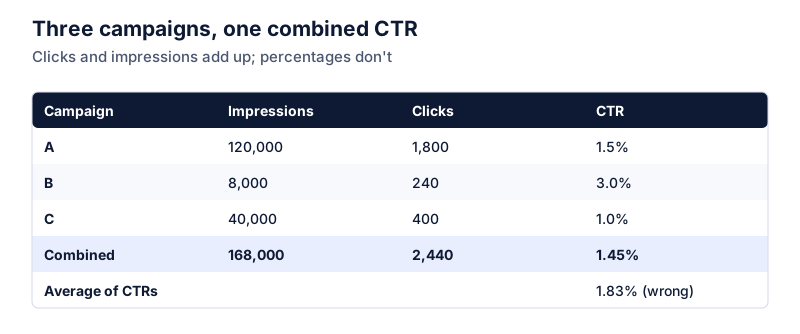
- Ad campaigns with different numbers of impressions. See click-through rate.
- Monthly rates in months with different volumes, like conversion or savings rate.
- Survey results from regions of different sizes.
When equal weighting is intended
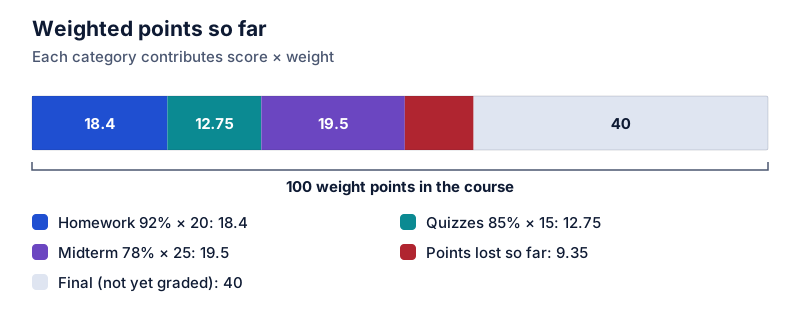
Sometimes groups are meant to count equally, regardless of size. A course where homework, the midterm and the final are each a third of the grade averages their percentages directly. That’s a deliberate weighting choice, not an error. See weighted grades.
Averaging percentage changes
Percentage changes over time have a related problem. Averaging +50% and −50% gives 0%, but the value actually fell 25%. For growth rates, use the compound annual growth rate instead. See investment return and CAGR.
A warning about subgroups
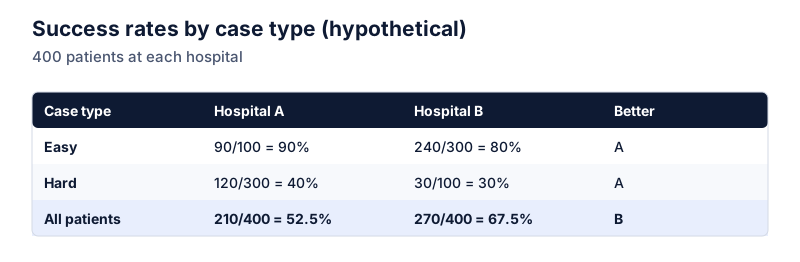
Combining groups can reverse a pattern: one option can win in every subgroup and still lose overall. That’s Simpson’s paradox, and it happens when group sizes are very unequal between the options being compared.
Questions
When is a simple average of percentages correct?
When every percentage has the same base size, or when you deliberately want each group to count equally (for example, a course where each test is worth the same share of the grade).
What if I only have the percentages and the group sizes?
Multiply each percentage by its group size to recover the counts, add them, and divide by the total size. That’s a weighted average.
The calculator links in this guide are checked against the PercentSwift calculator every time the site is built. How we calculate explains the rounding rules. If you spot a mistake, email hello@percentswift.com.