Reading poll percentages: what the margin of error means
What a poll's margin of error means, the standard formula for a proportion, values for common sample sizes, and why a lead between two candidates needs roughly double the margin.
For a simple random sample, the 95% margin of error for a percentage is about 1.96 × √(p(1 − p) ÷ n). With 1,000 respondents and a result near 50%, that’s about ±3.1 percentage points. The margin on the gap between two candidates in the same poll is nearly twice as large, so a 4-point lead with a ±3.1 margin may not be a real lead.
On this page
A poll asks a sample of people and uses their answers to estimate what a whole population thinks. The margin of error describes how far the estimate might be from the true figure just because of who happened to be sampled.
The formula
For a percentage from a simple random sample, at the usual 95% confidence level:
margin of error ≈ 1.96 × √(p × (1 − p) ÷ n)
Where p is the result as a decimal and n is the number of respondents
With 1,000 respondents and p = 0.5: 1.96 × √(0.25 ÷ 1,000) = 1.96 × 0.0158 = 0.031, so ±3.1 percentage points.
The margin is largest when p is 50% and shrinks as results move toward 0% or 100%. Pollsters usually report the 50% figure as the poll’s overall margin.
Margin by sample size
| Respondents | Margin of error (at 50%) |
|---|---|
| 100 | ±9.8 points |
| 400 | ±4.9 points |
| 600 | ±4.0 points |
| 1,000 | ±3.1 points |
| 1,500 | ±2.5 points |
| 2,500 | ±2.0 points |
Halving the margin takes four times the sample. That’s why most national polls use about 1,000 to 1,500 people.
Is the lead real?
A poll of 1,000 shows Candidate A at 48% and B at 44%: a 4-point lead.
Try it: 44% to 48%: the gap in points
Open in calculator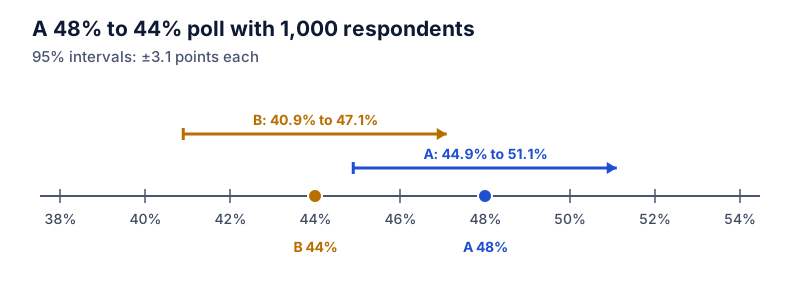
Each figure has a margin of about ±3.1 points. But the lead is the difference between two estimates from the same sample, and its margin is larger. A common approximation is:
margin of the lead ≈ 1.96 × √((pA + pB − (pA − pB)²) ÷ n)
Here: 1.96 × √((0.48 + 0.44 − 0.0016) ÷ 1,000) ≈ ±5.9 points. A 4-point lead is inside that, so the poll is consistent with a tie. A rough rule: a lead needs to be about twice the reported margin before it’s clearly outside the noise.
Changes between polls
If a candidate goes from 44% to 47% between two polls of 1,000, the 3-point change is also uncertain. The margin on a change between two independent polls is about 1.4 times the single-poll margin, roughly ±4.4 points here. Movements of a few points are often noise. Averages of several polls are more reliable than any single one.
Subgroups have bigger margins
If the poll reports results for 18–29-year-olds and only 150 respondents are in that group, the margin for that subgroup is about ±8 points. Be cautious with subgroup claims.
What the margin leaves out
The formula assumes a random sample. Real polls adjust (weight) their samples to match the population, which increases the effective margin somewhat. And non-sampling errors, such as people who won’t answer, question wording, or late changes of mind, aren’t captured at all.
For the difference between points and percent in poll reporting, see percentage points vs percent. For the same sampling issue in business data, see conversion rate. Rounded poll numbers often don’t sum to 100: see why percentages don’t add to 100.
Questions
Does a bigger population need a bigger sample?
Hardly. For large populations, the margin of error depends on the sample size, not the population size. 1,000 people gives about ±3 points whether the population is a city or a country.
Is the margin of error the only source of error?
No. It covers random sampling error only. Who answers, how questions are worded, and how the sample is weighted can all add error that the margin doesn’t include.
The calculator links in this guide are checked against the PercentSwift calculator every time the site is built. How we calculate explains the rounding rules. If you spot a mistake, email hello@percentswift.com.