Row, column and total percentages in a data table
In a two-way table you can divide by the row total, the column total or the grand total. Each answers a different question. All three worked on one survey table.
Row percentage = cell ÷ row total. Column percentage = cell ÷ column total. Total percentage = cell ÷ grand total. In a survey where 120 of 160 under-35s prefer remote work, the row percentage is 75%; those 120 are 57.1% of everyone who prefers remote work and 30% of all 400 respondents.
On this page
A two-way table has three kinds of totals, and each gives a different percentage for the same cell.
The data
| Prefer remote | Prefer office | Row total | |
|---|---|---|---|
| Under 35 | 120 | 40 | 160 |
| 35 and over | 90 | 150 | 240 |
| Column total | 210 | 190 | 400 |
Row percentages: within each row
Divide each cell by its row total. Question answered: within each age group, what share prefers each option?
Under 35, remote: 120 ÷ 160 = 75%. 35 and over, remote: 90 ÷ 240 = 37.5%.
Try it: 120 of 160 under-35s
Open in calculator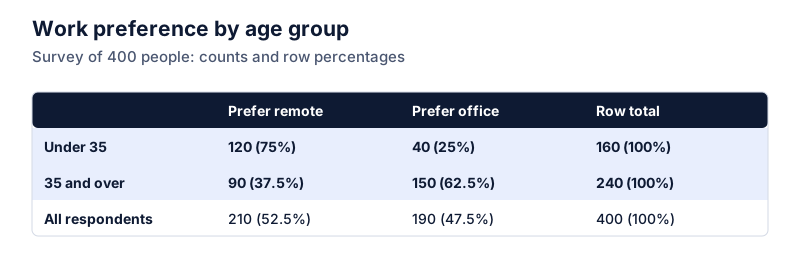
Column percentages: within each column
Divide each cell by its column total. Question answered: among people who prefer each option, what share falls in each age group?
Prefer remote, under 35: 120 ÷ 210 = 57.1%. So most remote-work fans in this survey are under 35.
Try it: 120 of 210 who prefer remote work
Open in calculatorTotal percentages: out of everyone
Divide each cell by the grand total. Question answered: what share of all respondents is in this cell?
Under 35 and prefer remote: 120 ÷ 400 = 30%.
Same cell, three answers
| Percentage | Calculation | Result | Reads as |
|---|---|---|---|
| Row | 120 ÷ 160 | 75% | 75% of under-35s prefer remote |
| Column | 120 ÷ 210 | 57.1% | 57.1% of remote fans are under 35 |
| Total | 120 ÷ 400 | 30% | 30% of respondents are under-35 remote fans |
All three are correct. Mixing them up is a common source of wrong claims, like reading “57% of remote fans are under 35” as “57% of under-35s want remote work”.
Choosing for a chart
To compare groups (do younger people prefer remote work more?), use row percentages, because they remove the effect of group size. The under-35 group is smaller (160 vs 240), so raw counts would understate its preference.
Rounding
Rows of percentages may add to 99.9% or 100.1% after rounding. That’s expected; see why percentages don’t add to 100.
When subgroups mislead
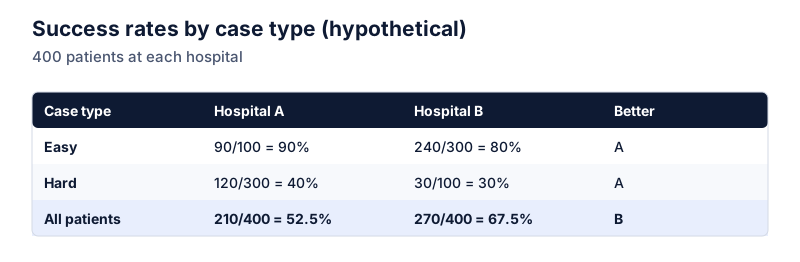
Combining rows can hide or reverse a pattern that appears within each row, a situation called Simpson’s paradox. For one-way frequency tables, see relative frequency percentages. To build these tables in a spreadsheet, see percentage of total in Excel.
Questions
Which percentage should I use?
Decide what group you’re describing. If the question starts with “among under-35s…”, use row percentages. If it starts with “among people who prefer remote work…”, use column percentages.
Why don't my column percentages add to 100% across a row?
They aren’t supposed to. Column percentages add to 100% down each column; row percentages add to 100% across each row.
The calculator links in this guide are checked against the PercentSwift calculator every time the site is built. How we calculate explains the rounding rules. If you spot a mistake, email hello@percentswift.com.