Simpson's paradox: when the overall percentage tells the opposite story
A treatment can win in every subgroup and still lose overall. A worked example of Simpson's paradox with two hospitals, why the combined percentage flips, and how to spot it in your own data.
Simpson’s paradox happens when groups are mixed in different proportions. Hospital A has the better success rate for both easy cases (90% vs 80%) and hard cases (40% vs 30%), but a worse overall rate (52.5% vs 67.5%), because 75% of its patients are hard cases.
On this page
Two hospitals each treat 400 patients for the same condition. Hospital B has a 67.5% success rate and Hospital A only 52.5%. Hospital B sounds better. But split the patients into easy and hard cases, and Hospital A wins in both groups. This reversal is called Simpson’s paradox. The numbers below are made up to show the effect clearly.
The numbers
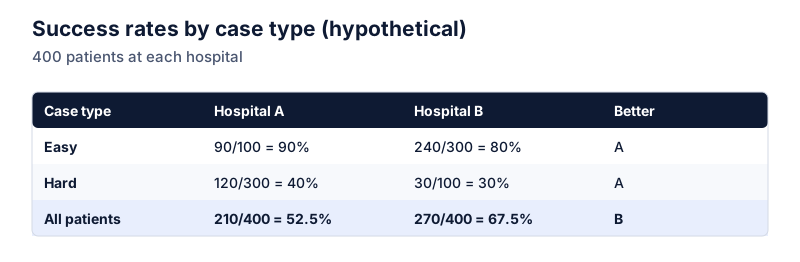
Overall, Hospital A succeeds with 210 of 400 patients:
Try it: 210 of 400 at Hospital A
Open in calculatorAnd Hospital B with 270 of 400:
Try it: 270 of 400 at Hospital B
Open in calculatorYet Hospital A has the higher rate for easy cases (90% vs 80%) and for hard cases (40% vs 30%).
Why the totals flip
The overall rate is a weighted average of the subgroup rates, weighted by how many patients are in each group.
- Hospital A: 25% easy, 75% hard. Overall = 0.25 × 90% + 0.75 × 40% = 52.5%.
- Hospital B: 75% easy, 25% hard. Overall = 0.75 × 80% + 0.25 × 30% = 67.5%.
Hospital A’s overall rate is dragged toward 40% because most of its patients are hard cases. Hospital B’s is pulled toward 80%. The overall comparison is mostly measuring caseload, not quality.
overall rate = Σ (share of group × rate in group)
Where shares are each group’s fraction of that hospital’s patients
Where it shows up
- Admissions. A university can admit a lower share of women overall while admitting a higher share in every department, if women apply more often to departments that admit few applicants.
- Sales. A sales rep can have better conversion on both small and large deals and a worse overall rate, if their deals are mostly the hard-to-close large ones.
- Medical studies. A treatment given mostly to sicker patients can look worse overall than one given to healthier ones.
How to check your data
- When comparing overall percentages, ask whether the groups differ in composition (age, size, difficulty, region).
- Break the rates down by that factor.
- If the subgroup comparison disagrees with the overall one, report both and explain the mix.
Which number to trust
Neither number is wrong. The subgroup rates answer “who does better with the same kind of case?” The overall rate answers “what share of all patients succeeded?” Which matters depends on the question. Deciding whether a grouping is the right one to adjust for is a judgment about cause and effect, and that part can’t be settled by the percentages alone.
The arithmetic behind this is the same as in averaging percentages. For laying out the breakdown, see percentage of total in a table. For how health studies report differences, see relative vs absolute risk.
Questions
So which hospital is better?
In this example, Hospital A, because it does better on every type of case, and the overall figure is skewed by its harder caseload. In real data the answer depends on whether the grouping variable is a genuine cause of the outcome, which takes subject knowledge, not just arithmetic.
Is Simpson's paradox rare?
It’s not common for the direction to flip completely, but smaller distortions from different group mixes are very common. Any time you compare overall rates between groups with different compositions, it’s worth looking at the breakdown.
The calculator links in this guide are checked against the PercentSwift calculator every time the site is built. How we calculate explains the rounding rules. If you spot a mistake, email hello@percentswift.com.