Index numbers: setting a base of 100 to compare growth
Rebase any series to 100 to compare growth on one scale. Index = value ÷ base value × 100. Worked example comparing house prices and wages, plus how to read index changes correctly.
Index = value ÷ base-period value × 100. A house price that goes from $300,000 to $378,000 has an index of 126 against a base of 100, meaning it’s 26% higher than the base year. Indexing two series to the same base lets you compare their growth even when the units differ.
On this page
House prices are in dollars, wages are in dollars per year, and population is in people. Plotting them on one chart is awkward because the scales are so different. Index numbers fix this by converting each series to the same starting point: 100.
The formula
index = value ÷ base value × 100
Where the base value is the value in the chosen base period
In the base period the index is always 100. A later index of 126 means “26% above the base.”
Worked example
A typical house costs $300,000 in 2020 and $378,000 in 2024. Annual wages go from $52,000 to $60,320. These are made-up figures for the example.
| Year | House price | Index | Wages | Index |
|---|---|---|---|---|
| 2020 | $300,000 | 100 | $52,000 | 100 |
| 2021 | $318,000 | 106 | $53,560 | 103 |
| 2022 | $351,000 | 117 | $56,160 | 108 |
| 2023 | $366,000 | 122 | $58,240 | 112 |
| 2024 | $378,000 | 126 | $60,320 | 116 |
For 2024 house prices: 378,000 ÷ 300,000 × 100 = 126. Check the growth with the calculator:
Try it: $300,000 → $378,000
Open in calculatorAnd wages:
Try it: $52,000 → $60,320
Open in calculator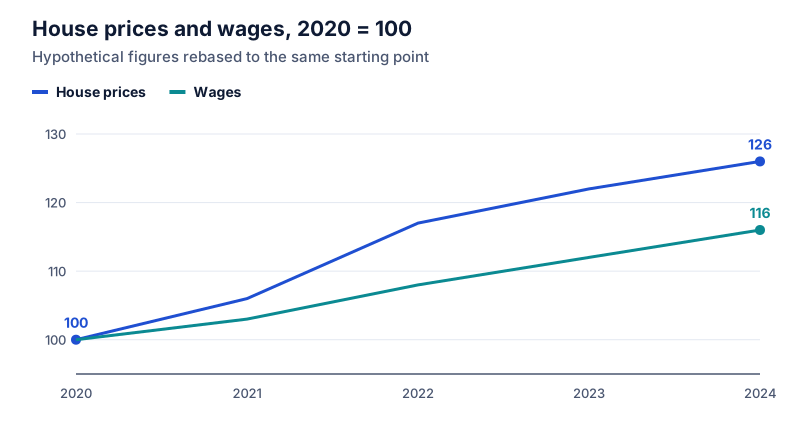
Reading index changes
The index minus 100 gives the percentage change from the base, and only from the base. Between two later years, work out the percentage change of the index values, not the difference:
- 2022 to 2024 house prices: 117 → 126 is a 9-point rise in the index.
- As a percentage: (126 − 117) ÷ 117 = 7.7%.
The 9 points and the 7.7% describe the same change in different ways. It’s the same distinction as percentage points vs percent.
Rebasing an existing index
To move an index to a new base year, divide every value by the new base year’s value and multiply by 100. To rebase the house series to 2022: 126 ÷ 117 × 100 ≈ 107.7 for 2024.
Where you’ll see index numbers
- Consumer price indexes track the cost of a fixed basket of goods. That’s how inflation is measured, and how purchasing power is calculated.
- Stock market indexes start at an arbitrary base value and track changes from there.
- Business dashboards often index monthly revenue to January = 100 to compare product lines of very different sizes.
Why indexing beats dual axes
Charts with two vertical axes can be stretched to tell almost any story. Rebasing both series to 100 and plotting them on one axis shows their relative growth honestly. See misleading percentage charts for more on this, and YoY vs MoM growth for comparing growth rates over different periods.
Questions
Does the base year have to be the first year?
No. Any period can be the base. Statistical agencies often pick a recent year or an average of several years. Changing the base rescales every value but doesn’t change the percentage change between any two periods.
Can I average or add index numbers?
Averaging index values for one series over time is fine. Adding indexes from different series isn’t meaningful unless they were built as weighted parts of one total, as in a price index.
The calculator links in this guide are checked against the PercentSwift calculator every time the site is built. How we calculate explains the rounding rules. If you spot a mistake, email hello@percentswift.com.