How to calculate conversion rate and compare it between periods
Conversion rate = conversions ÷ visitors (or sessions) × 100. How to choose the denominator, read a funnel step by step, and avoid overreacting to small samples.
Conversion rate = conversions ÷ the number of people or sessions that could have converted × 100. 460 orders from 18,400 visitors is a 2.5% conversion rate. Use the same denominator every time you compare periods, and be careful with small numbers, which swing widely by chance.
On this page
conversion rate = conversions ÷ opportunities × 100
A store had 18,400 visitors last month and 460 orders. Conversion rate: 460 ÷ 18,400 = 2.5%.
Try it: 460 orders from 18,400 visitors
Open in calculatorChoosing the denominator
“Opportunities” can mean different things, and each gives a different rate:
- Sessions (visits): every visit counts, so returning visitors count more than once. Common in web analytics tools.
- Users (people): each person counts once. Usually gives a higher rate than sessions.
- Leads, trials, or sign-ups: for later steps, such as trial-to-paid conversion.
None is wrong. What matters is that you compare like with like. A rate based on users this month and sessions last month can show a change that didn’t happen.
Funnel rates
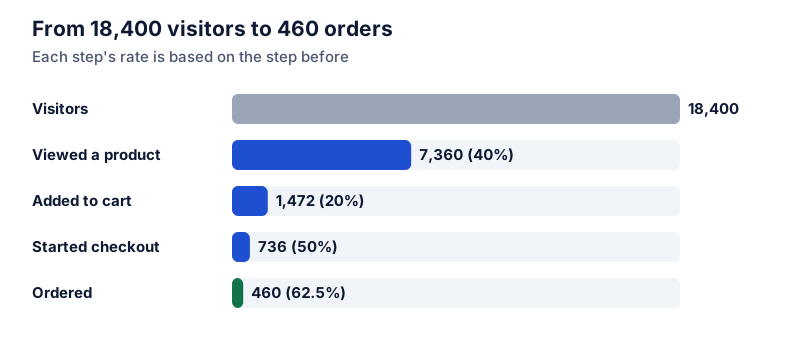
Breaking the path into steps shows where people drop off.
| Step | Count | Rate from previous step |
|---|---|---|
| Visitors | 18,400 | |
| Viewed a product | 7,360 | 40% |
| Added to cart | 1,472 | 20% |
| Started checkout | 736 | 50% |
| Ordered | 460 | 62.5% |
The step rates multiply to the overall rate. Raising any one step raises the overall rate proportionally: moving add-to-cart from 20% to 25% (a 25% relative improvement) lifts overall conversion from 2.5% to 3.125%.
Comparing periods
If conversion goes from 2.5% to 3.0%, that’s a rise of 0.5 percentage points, or a 20% relative increase. Report the points and the rates; “conversion up 20%” alone can be misread. See percentage points vs percent.
Small numbers swing
With 100 visitors, 3 orders is 3% and 5 orders is 5%. That looks like a big difference, but a couple of orders either way is ordinary chance. As a rough guide, the uncertainty in a rate based on a few dozen conversions is large enough that week-to-week changes of a percentage point or more can be noise. Wait for more data, compare over longer periods, or use a proper significance test for experiments. The guide on margin of error explains the statistics.
Try it: 3 orders from 100 visitors
Open in calculatorRevenue matters too
A higher conversion rate isn’t always better if it comes from discounting. Track revenue per visitor (revenue ÷ visitors) alongside conversion. A 2.5% rate with $80 average orders brings $2.00 per visitor; a 3% rate with $60 orders brings $1.80.
Related measures: click-through rate for ads and emails, and churn and retention for subscribers after they convert.
Questions
What is a good conversion rate?
It depends heavily on the industry, the price, the traffic source and what counts as a conversion. Your own history is a better benchmark than published averages.
Should I count repeat orders from the same visitor?
For an orders-per-session rate, yes. For a share-of-people rate, count each buyer once. Pick one definition and keep it.
The calculator links in this guide are checked against the PercentSwift calculator every time the site is built. How we calculate explains the rounding rules. If you spot a mistake, email hello@percentswift.com.