How to calculate a class average and pass rate
Class average and pass rate measure different things. How to calculate each, the change between tests, and how the average can rise while the pass rate falls.
Class average = sum of scores ÷ number of students. Pass rate = students who passed ÷ students who took the test × 100. If 17 of 25 students pass, the pass rate is 68%. A pass rate falling from 72% to 68% is a drop of 4 percentage points, even if the class average went up.
On this page
Two numbers summarize most class results: the average score and the pass rate. They answer different questions, and they can move in opposite directions.
Class average
class average = sum of all scores ÷ number of students
If 25 students’ scores add up to 1,775, the average is 1,775 ÷ 25 = 71%.
Pass rate
pass rate = students who passed ÷ students who took the test × 100
17 of 25 students scored 60% or above. The pass rate is 17 ÷ 25 = 68%.
Try it: 17 of 25 students passed
Open in calculatorComparing two tests
| Test 1 | Test 2 | |
|---|---|---|
| Class average | 68% | 71% |
| Students passing | 18 of 25 | 17 of 25 |
| Pass rate | 72% | 68% |
The average went up 3 points. The pass rate went down 4 points. How?
On test 2, the students who were already passing did better, raising the average. Meanwhile one student who had just passed test 1 fell below 60%. The average is sensitive to every score; the pass rate only notices students who cross the line.
Try it: Pass rate from 72% to 68%
Open in calculatorDescribe the pass rate change in percentage points (“down 4 points”). As a relative change, it’s 4 ÷ 72 = a 5.6% decrease, which is easy to confuse with the points figure.
Which number to watch
- The average shows overall performance and is good for spotting whether teaching changes helped most students.
- The pass rate shows how many students reached the standard. It’s what matters when a pass has consequences.
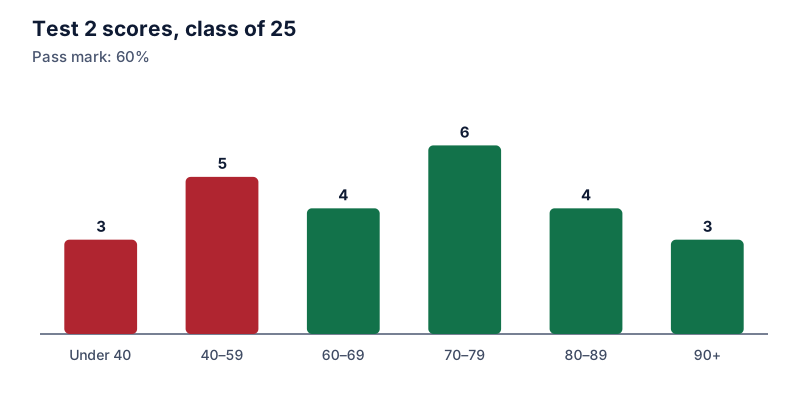
- The distribution (how many students fall in each score band) shows both, and where the problems are. A class with a 71% average could have everyone between 65 and 78, or half the class above 90 and a quarter below 40.
Averaging across classes
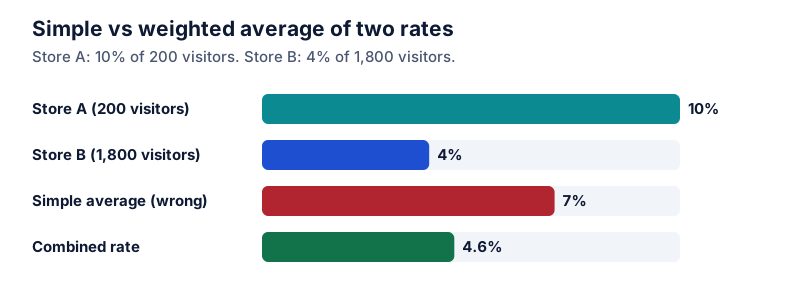
If two classes have pass rates of 80% (20 students) and 60% (30 students), the combined pass rate isn’t 70%. It’s (16 + 18) ÷ 50 = 68%. Always combine counts, not percentages. See average of percentages.
Grade bands as percentages
To report how many students got each grade, divide each count by the class size. In the chart above, 3 of 25 scored 90 or above, which is 12%. The guide on relative frequency percentages covers frequency tables. For individual scores, see test score percentage.
Questions
Should absent students count in the pass rate?
Usually the pass rate is based on students who took the test. If you report it against all enrolled students, say so, because the numbers can differ a lot.
Is the median a better average?
When a few very high or very low scores pull the mean, the median (the middle score) can describe a typical student better. Reporting both is common.
The calculator links in this guide are checked against the PercentSwift calculator every time the site is built. How we calculate explains the rounding rules. If you spot a mistake, email hello@percentswift.com.