Comparing groups of different sizes: percentages and rates per 1,000
Raw counts mislead when groups differ in size. Convert to a percentage or a rate per 1,000 so a town of 8,500 and a city of 120,000 can be compared fairly. Worked examples and formulas.
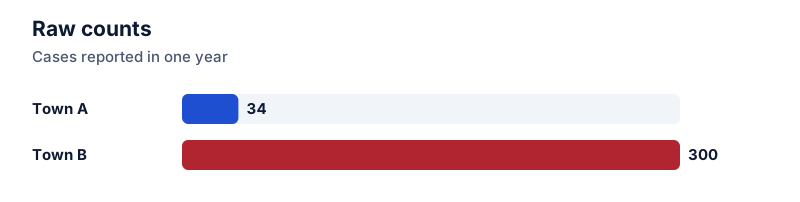
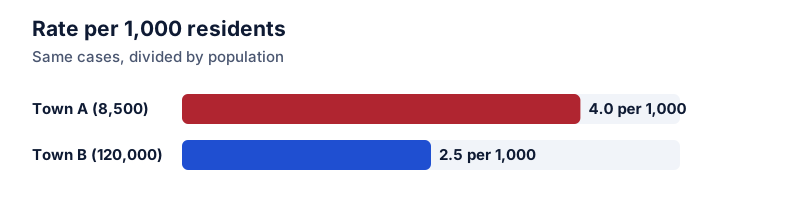
Rate per 1,000 = count ÷ population × 1,000. A percentage is the same idea per 100. A town with 34 cases among 8,500 people has 4 per 1,000 (0.4%), which is higher than a city with 300 cases among 120,000 (2.5 per 1,000, or 0.25%), even though the city has more cases.
On this page
Town B reports 300 cases of a seasonal illness in a year. Town A reports 34. Town B has the bigger problem, right? Not necessarily: Town B has 120,000 residents and Town A has 8,500. To compare places, schools, or clinics of different sizes, you need a rate.
Percentages are rates per 100
A percentage is a count divided by a total, times 100. For Town A:
34 ÷ 8,500 × 100 = 0.4%
Where 8,500 is the population
Try it: 34 cases among 8,500
Open in calculatorFor Town B, 300 ÷ 120,000 = 0.25%.
Try it: 300 cases among 120,000
Open in calculatorRates per 1,000 or 100,000
Small percentages are hard to read. Multiply by 1,000 instead of 100 and you get a rate per 1,000:
rate per 1,000 = count ÷ population × 1,000
Where per 100,000 uses × 100,000
- Town A: 34 ÷ 8,500 × 1,000 = 4 per 1,000
- Town B: 300 ÷ 120,000 × 1,000 = 2.5 per 1,000
Shifting between them is just moving the decimal point: 0.4% = 4 per 1,000 = 400 per 100,000.
Comparing the two rates
Town A’s rate is higher. How much higher depends on which comparison you mean:
- Difference: 4 − 2.5 = 1.5 more cases per 1,000 people.
- Ratio: 4 ÷ 2.5 = 1.6, so Town A’s rate is 60% higher.
Both are correct. Saying which one you’re using avoids confusion, the same way absolute and relative change do.
Pick the right denominator
A rate is only as good as its denominator. Some choices to think about:
- Population at risk. A rate of school injuries should divide by students, not by all residents.
- Exposure. Accidents per 1,000 drivers differs from accidents per million miles driven. A town of long commutes can look worse per driver and better per mile.
- Time period. State whether the rate is per year, per month or over the whole study.
Small numbers
Rates for small groups are noisy. If Town A had 42 cases next year instead of 34, its rate would jump to about 4.9 per 1,000, a large-looking rise from only 8 more cases. Showing counts next to rates, or averaging several years, gives readers a sense of how stable the figure is.
Don’t average rates directly
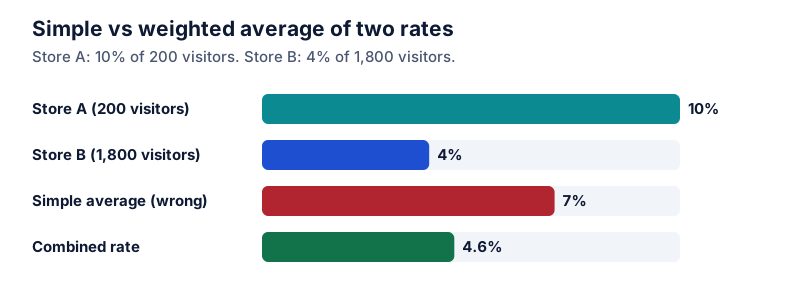
To combine the two towns, add the counts and the populations: 334 ÷ 128,500 × 1,000 ≈ 2.6 per 1,000. Averaging 4 and 2.5 to get 3.25 would treat both towns as if they were the same size. The average of percentages guide explains why.
Health headlines often report relative changes in rates. For how to read those, see relative vs absolute risk.
Questions
When should I use per 1,000 or per 100,000 instead of percent?
Use whichever keeps the numbers readable. Common events suit percentages. Rare events give tiny percentages like 0.004%, which are easier to read as 4 per 100,000. Crime and disease statistics often use per 100,000 for this reason.
Are rates for small towns reliable?
Less so. With small populations, a handful of extra cases moves the rate a lot from year to year. Averaging over several years or showing the raw count alongside the rate helps.
The calculator links in this guide are checked against the PercentSwift calculator every time the site is built. How we calculate explains the rounding rules. If you spot a mistake, email hello@percentswift.com.