How to calculate budget variance as a percentage
Budget variance % = (actual − budget) ÷ budget × 100. How to label variances as favorable or unfavorable for costs and revenue, with a department-by-department example.
Variance % = (actual − budget) ÷ budget × 100. Marketing budgeted $40,000 and spent $43,800, a +9.5% variance. For costs, a positive variance is unfavorable (overspent); for revenue, a negative variance is unfavorable (short of target). Always divide by the budget.
On this page
A budget variance compares what happened with what was planned.
variance (amount) = actual − budget
variance (%) = (actual − budget) ÷ budget × 100
Worked example
| Line | Budget | Actual | Variance | Variance % | Assessment |
|---|---|---|---|---|---|
| Marketing | $40,000 | $43,800 | +$3,800 | +9.5% | unfavorable |
| IT | $85,000 | $81,600 | −$3,400 | −4.0% | favorable |
| Travel | $12,000 | $9,900 | −$2,100 | −17.5% | favorable |
| Revenue | $500,000 | $470,000 | −$30,000 | −6.0% | unfavorable |
Try it: Marketing: budget $40,000, actual $43,800
Open in calculator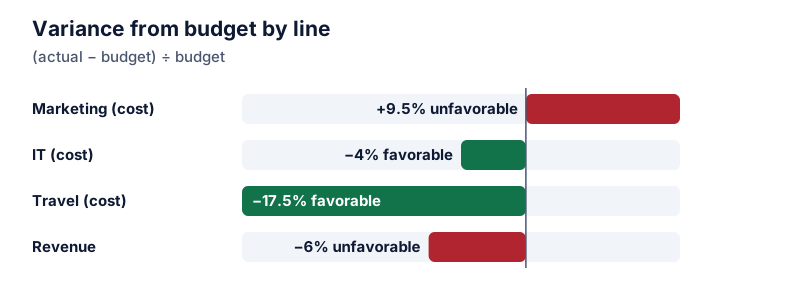
Favorable or unfavorable
The sign alone doesn’t tell you whether a variance is good news:
- Costs: spending more than budget (positive variance) is unfavorable. Spending less is favorable.
- Revenue and profit: coming in above budget (positive) is favorable. Below budget is unfavorable.
Many reports add an F or U label, or flip signs so that favorable is always positive. Either is fine as long as the report says which convention it uses.
Try it: Revenue: budget $500,000, actual $470,000
Open in calculatorAlways divide by the budget
The budget is the reference point, so it goes on the bottom. Dividing by the actual figure gives a different number. Marketing’s $3,800 overspend is 9.5% of budget but 8.7% of actual spending.
Percent and dollars together
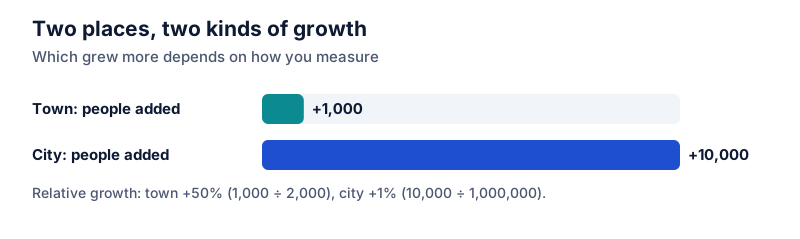
Percentages make lines of different sizes comparable. Dollars show what matters to the total. Travel’s −17.5% is the largest percentage, but revenue’s −6% is $30,000, far more than every cost variance combined. A variance report should show both columns.
Timing differences
A variance can come from timing rather than over- or underspending. If a $12,000 software renewal was budgeted for March but paid in February, February shows a big unfavorable variance and March a big favorable one. Year-to-date variances smooth this out.
Negative budgets
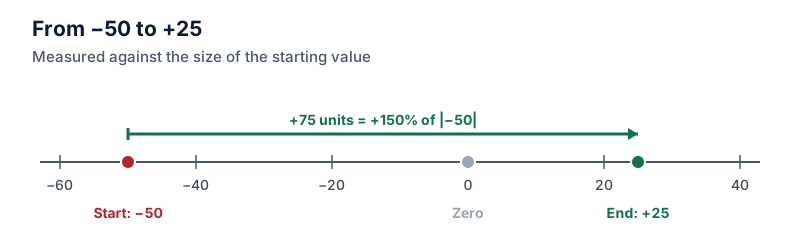
Some lines can be negative, such as a budgeted loss or a net transfer. For those, use the absolute value of the budget in the denominator so the sign still points the right way. See percentage change with negative numbers.
Flexible budgets
When sales volume differs from plan, some variance in costs is expected. A flexible budget adjusts the cost budget to the actual volume before comparing. If production was 10% above plan, a materials budget of $50,000 flexes to $55,000, and only spending beyond that counts as a variance.
For the general idea behind variance percentages, see how to calculate percentage increase and absolute vs relative change.
Questions
What if the budget for a line was zero?
The percentage is undefined, because you’d divide by zero. Report the variance in dollars instead.
What variance is big enough to investigate?
Many teams set a threshold in both dollars and percent, for example anything over 10% or $5,000. Using both avoids chasing large percentages on tiny lines or ignoring small percentages on big ones.
The calculator links in this guide are checked against the PercentSwift calculator every time the site is built. How we calculate explains the rounding rules. If you spot a mistake, email hello@percentswift.com.